soc-automation-lab
A working security operations lab that ties endpoint telemetry, alert triage, and automated case handling into a single pipeline. Wazuh handles detection, Shuffle runs the SOAR playbooks, and TheHive is the analyst workspace where cases land already enriched.
- ▸config/
- ▸wazuh/
- ▸dashboard/
- ▸decoders/
- ▸indexer/
- ▸lists/
- ▸manager/
- ▸rules/
- ▸docs/
- ▸screenshots/
- □01-wazuh-threat-hunting.png
- □02-wazuh-agent.png
- ▸integrations/
- ▸scripts/
- □enroll-agent.ps1
- ▸shuffle/
- ▸workflows/
SOC Automation Lab
A working security operations lab that ties endpoint telemetry, alert triage, and automated case handling into a single pipeline. Wazuh handles detection, Shuffle runs the SOAR playbooks, and TheHive is the analyst workspace where cases land already enriched.
I built this to stop doing the same three things by hand on every alert: pulling reputation data on an indicator, opening a case, and pinging the channel. The playbook does all of that in the few seconds between Wazuh firing and an analyst opening TheHive.
Architecture
flowchart LR
    A[Windows / Linux endpoints<br/>Wazuh agent] -->|events| B[Wazuh Manager]
    B -->|rule match| C[custom-thehive integration]
    C -->|webhook| D[Shuffle]
    D -->|enrich indicator| E[VirusTotal / OTX]
    D -->|create + tag case| F[TheHive]
    D -->|notify| G[Slack / email]
    F -->|analyst response| B
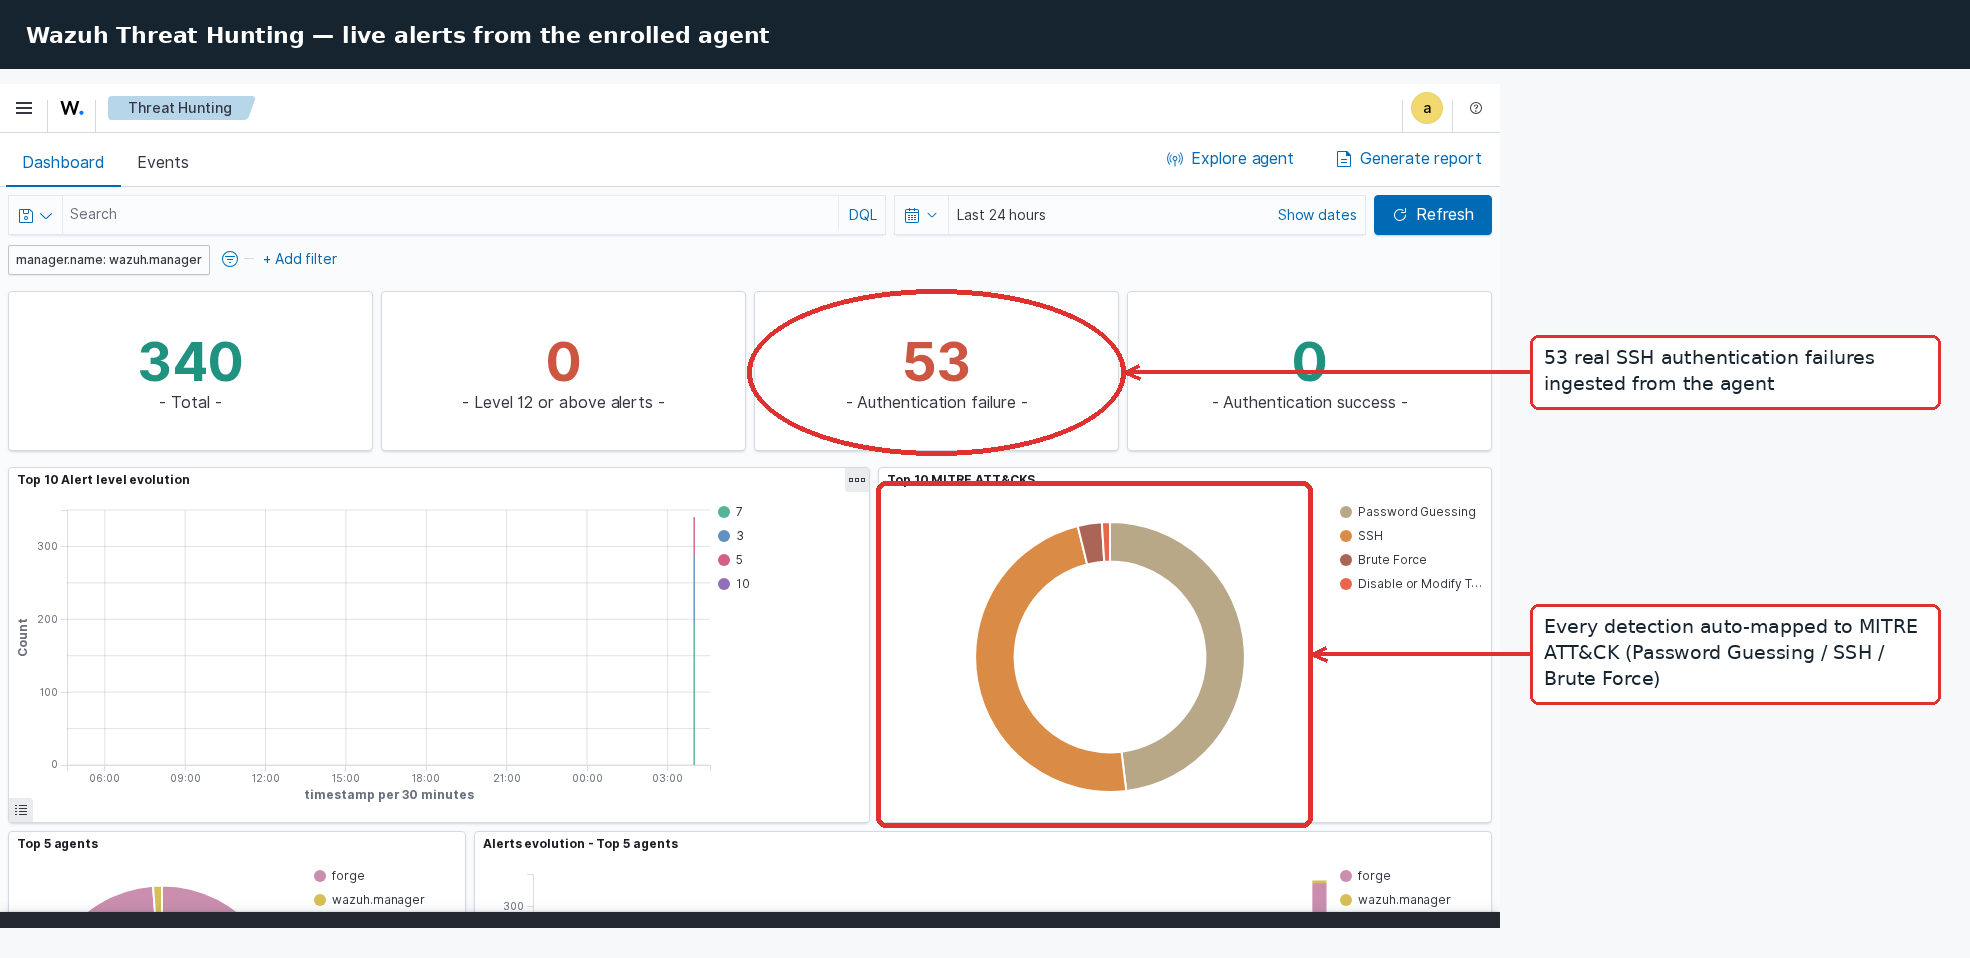
Telemetry flows up from the agents to the Wazuh manager. When a rule above the configured severity fires, the manager calls a Python integration that posts the alert to a Shuffle webhook. Shuffle pulls reputation on the offending indicator, opens a TheHive case with the verdict attached, sets severity from the score, and drops a message in the analyst channel. Everything after the rule match is hands off.
The detection layer, running with a Linux endpoint enrolled and an SSH brute-force replayed against it - alerts land already mapped to MITRE ATT&CK:
Stack
| Component | Role | Version pinned |
|---|---|---|
| Wazuh (indexer, manager, dashboard) | SIEM / detection | 4.9.0 |
| TheHive 5 + Cassandra + Elasticsearch | Case management | 5.4 |
| Cortex | Observable analyzers | 3.1 |
| Shuffle | SOAR / orchestration | 1.4.0 |
Layout
config/wazuh/        manager config, custom rules and decoders
integrations/        Wazuh -> Shuffle/TheHive integration
shuffle/             exported SOAR workflow + its compose file
scripts/             deploy and agent enrollment helpers
docs/                architecture notes and the playbook walkthrough
docker-compose.yml   Wazuh + TheHive stack
Bring it up
cp .env.example .env
# set the indexer/dashboard passwords and TheHive secret in .env first
./scripts/deploy.sh
deploy.sh generates the Wazuh indexer certificates, starts the stack, waits for
the indexer to go green, and prints the dashboard and TheHive URLs. Give it three
or four minutes on first run while Cassandra initializes.
Shuffle runs as its own stack so it survives a teardown of the SIEM side:
cd shuffle && docker compose up -d
Import shuffle/workflows/wazuh-thehive-enrichment.json from the Shuffle UI, drop
your VirusTotal/OTX keys and TheHive API key into the app authentication fields,
then copy the webhook URL into config/wazuh/manager/ossec.conf.
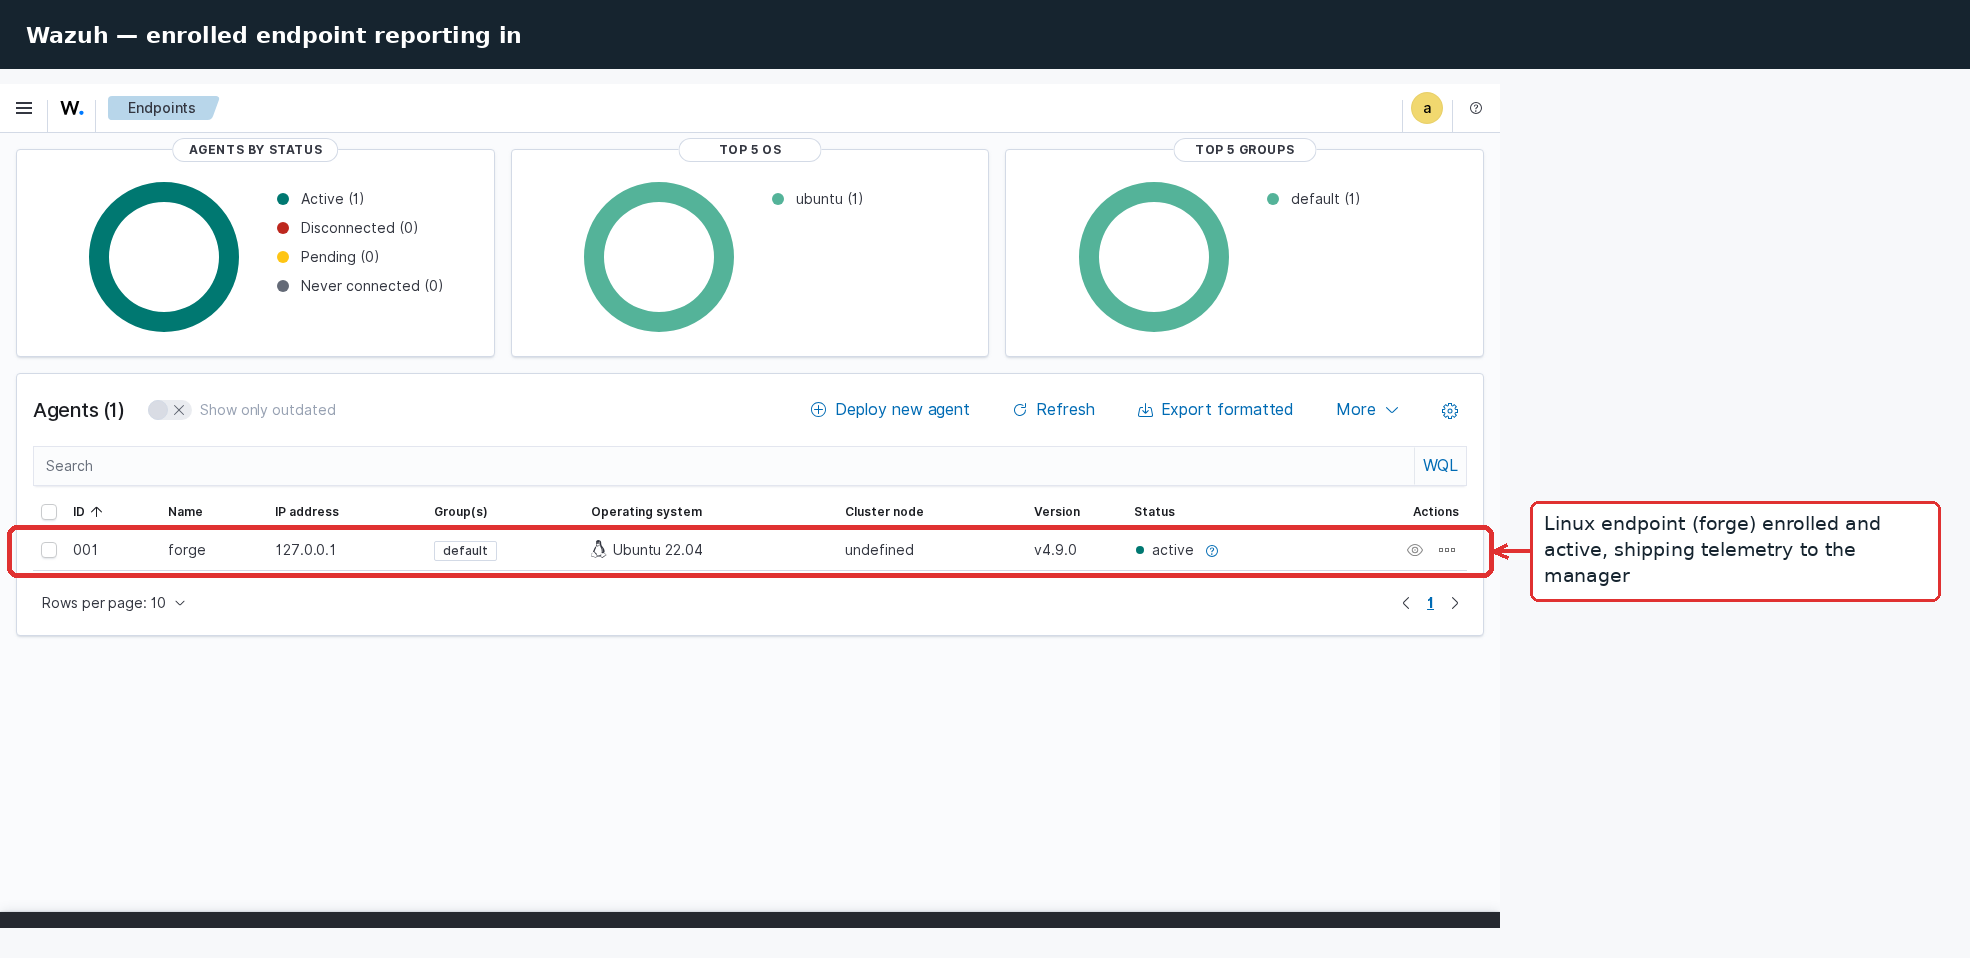
Enrolling an endpoint
Windows:
.\scripts\enroll-agent.ps1 -Manager REDACTED-IP -Group windows
Linux:
WAZUH_MANAGER=REDACTED-IP ./scripts/enroll-agent.sh
The Windows group ships a Sysmon-aware config so process-creation and network
events come through with enough context for the rules in local_rules.xml to be
useful.
What the rules cover
config/wazuh/rules/local_rules.xml adds detections on top of the Wazuh
ruleset for the cases I actually wanted automated:
- Sysmon process creation from suspicious paths (
AppData,Temp,ProgramData) - LSASS access patterns consistent with credential dumping
- New service creation and scheduled-task persistence
- Brute force against RDP / SSH escalated past the default threshold
- Outbound connections to indicators present in the CTI watchlists
Rules at level 10 and above hand off to the integration. Everything below stays in the dashboard.
The playbook
Full walkthrough with the decision points is in docs/playbook.md. Short version: alert in, indicator enriched, case out, analyst notified, with the raw alert and the enrichment verdict both attached to the case so triage starts from evidence instead of a blank ticket.
Notes
This is a lab build. The compose file runs everything single-node on one host, which is fine for a homelab or a demo but is not how you'd run any of these in production - Wazuh indexer and TheHive's Cassandra/Elasticsearch both want their own nodes and real resource headroom once you put load on them.